Dishit Shah | BTech CSE, Class of 2026
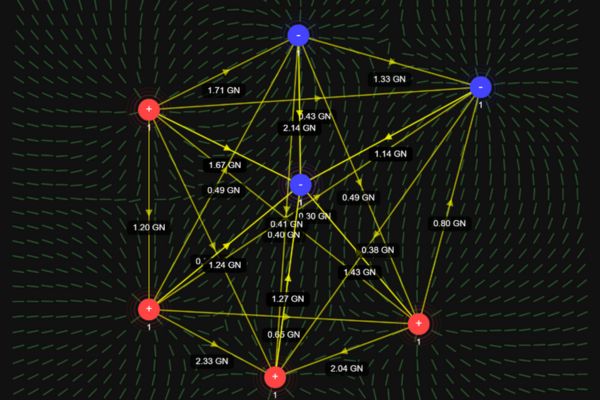
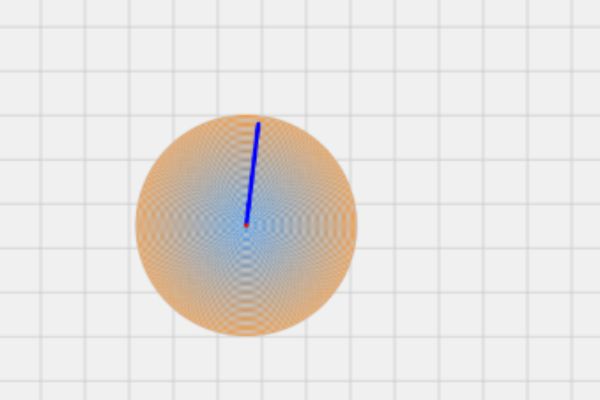
Electrostatic Interactions Visualiser: This dynamic project uses p5.js to simulate Coulomb’s and Gauss’s laws, visualising electrostatic interactions between charges. Adjust parameters like charge magnitude, mass, and distance to explore the relationship between electric flux and shapes, offering an engaging, interactive way to understand foundational physics concepts.
Nandita Dash | BA (Hons) Psychology, Class of 2026
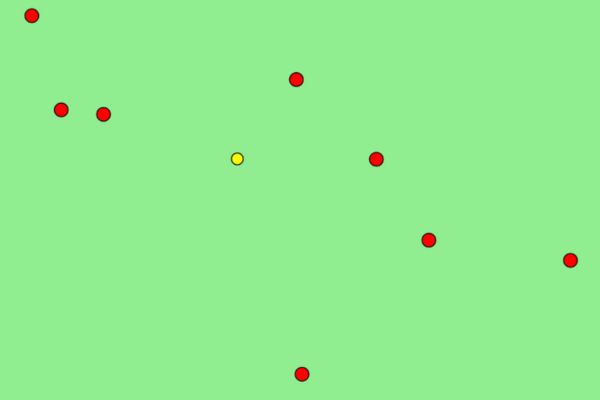
Reaction Time Experiment: This interactive experiment, built with p5.js, quantifies a participant's reaction time (RT) to a stimulus. Upon the appearance of a green screen, the participant's RT is recorded. The experimenter can then analyse the mean RT to assess the subject's ability to react, grounded in psychological principles of reaction time.
Vraj Shah | BBA Hons, Class of 2025
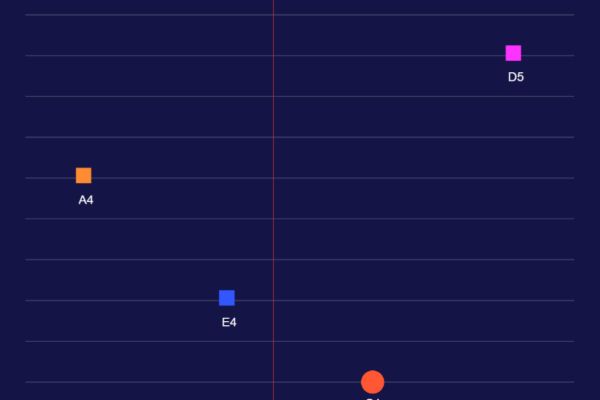
Interactive Music Composition Platform: This project offers an interactive space for users to explore and compose music using various instruments like piano, guitar, synth, and drums. Users can manipulate musical notes, adjust tempo and rhythm, and experiment with customisable time signatures and metronome mode. The platform provides an intuitive yet creative environment for both beginners and experienced musicians to learn and experiment with music composition.
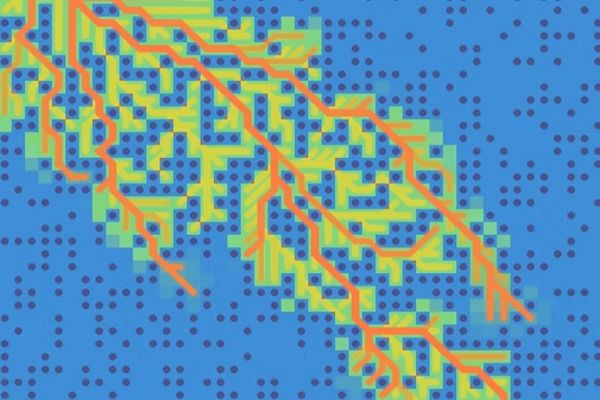
Dhruv Gajjar | BTech CSE, Class of 2025
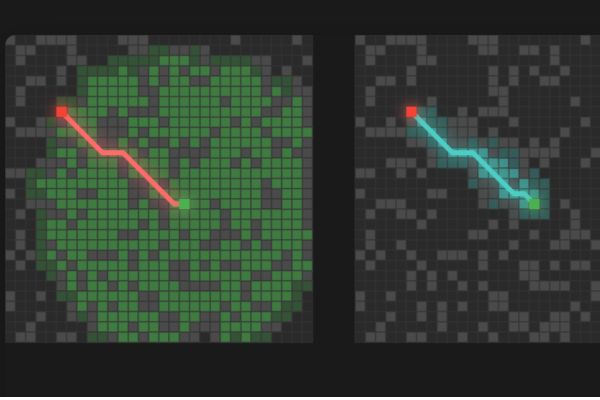
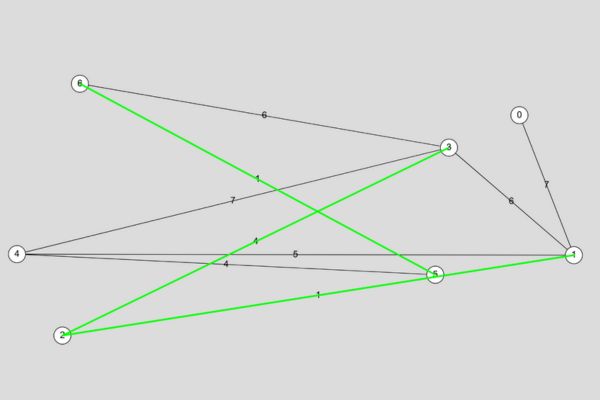
Dijkstra's and A* Algorithm: This interactive tool demonstrates Dijkstra's and A* algorithms. Users can add obstacles, set start and end points, and observe in real time as both algorithms find the shortest path. The tool includes speed sliders and graphs of performance metrics like execution time and steps taken, enhancing understanding.
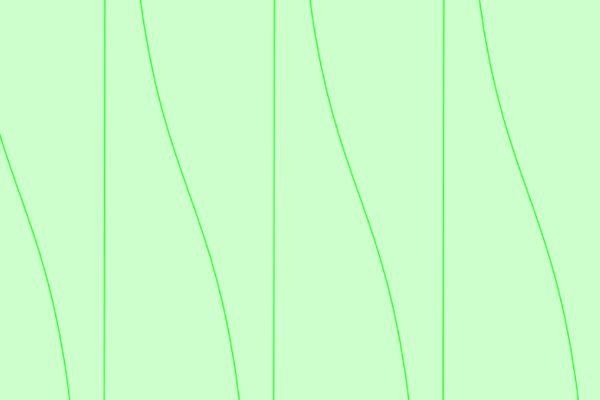
Maanit Shah | BS (Hons) CS, Class of 2026
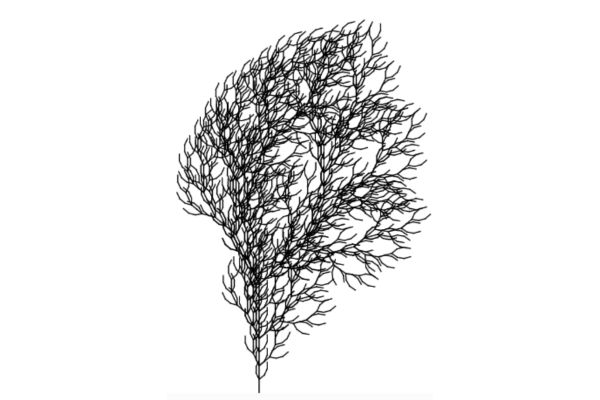
L-System Visualizer: Visualises L-systems, mathematical models used to simulate plant growth, based on ideas from the book "The Algorithmic Beauty of Plants." Users can control parameters like recursion depth, branch angle, and rules to create and explore fractal-like patterns that replicate natural forms in an interactive environment.
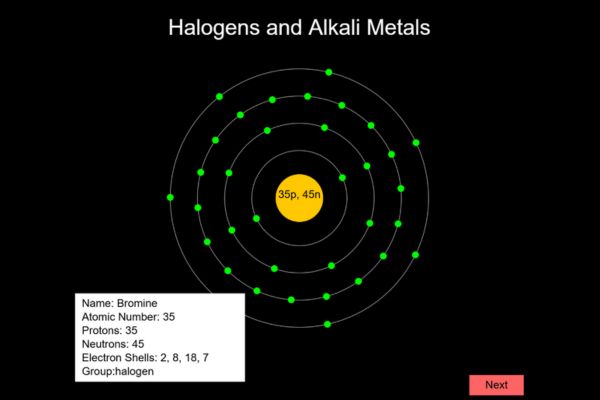
Vaishnavi Dahihande | BS (Hons) CS, Class of 2026
Periodic Table Elements Interaction: This interactive p5.js project explores halogens and alkaline metals through visual representation. Users can click on floating elements to examine atomic structures and bond selected elements. The simulation demonstrates covalent and ionic bonds, showing reactivity through colour changes, utilising click, hover, rotation, and colour functionality.
Varun Pujara | BTech CSE, Class of 2026
Fourier Series Visualizer:This project allows users to explore Fourier series by visualizing different waveform patterns (Square, Sawtooth, Triangle, Clausen, or Custom). Interactive sliders let users adjust parameters like numerator, denominator, and coefficients, helping bridge theory and application in signal processing and engineering.
Heli Shah | BA (Hons) Psychology, Class of 2026
Stroop Task Test: Visualising cognitive interference and its effect on attention and processing speed. Demonstrating the conflict between automatic and controlled processing highlights how perception and reality often clash, offering insight into cognitive dynamics.
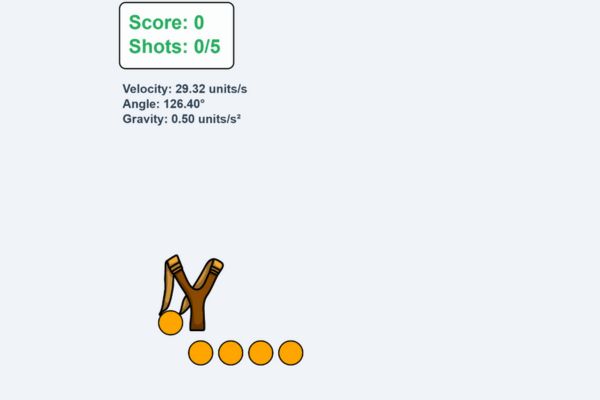
Tathya Shah | BTech CSE, Class of 2026
Slingshot Game: Test your aim and precision in this p5.js-powered slingshot game! Launch balls to hit a moving hoop and score points across two challenging levels. Adjust the slingshot’s angle and force, navigate real-time physics like gravity, and track your progress with a live score system.
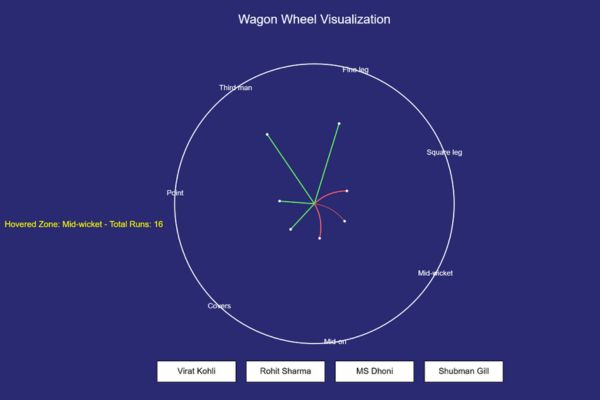
Hardagna Mehta | BTech CSE, Class of 2025
Cricket Performance Visualiser: This project compares batter performances in cricket by visualising player data on a cricket ground. Using dynamic graphics like wagon wheels and heatmaps, it transforms statistics into clear visual narratives, allowing fans to better understand and compare performances through engaging, charts and graphics.
Suhani Khatwani | BTech CSE, Class of 2027
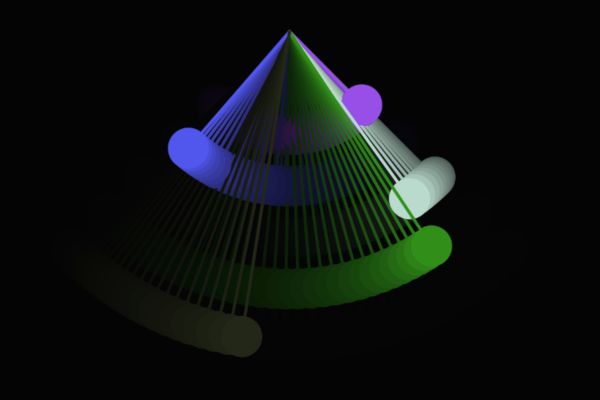
Pendulum Waves: Visualises pendulum motion, creating wave patterns by adjusting parameters like string length, angle, and speed. Users can interact with the simulation to observe how changes affect the wave creation, blending art, science, and technology to offer a clear, engaging demonstration of physics concepts.
Megh Vora | BBA Hons, Class of 2026
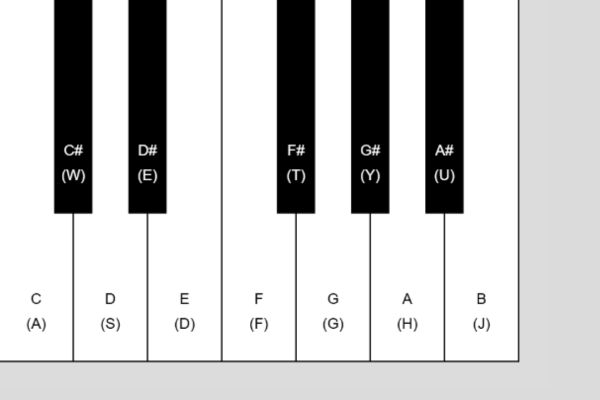
Interactive Music Theory Learning: Learn basic music theory by playing scales and chords on a keyboard. Each key corresponds to a note, providing both audio and visual feedback. Users can explore major/minor scales and basic chord structures, encouraging hands-on learning of fundamental music concepts in a fun and interactive way.
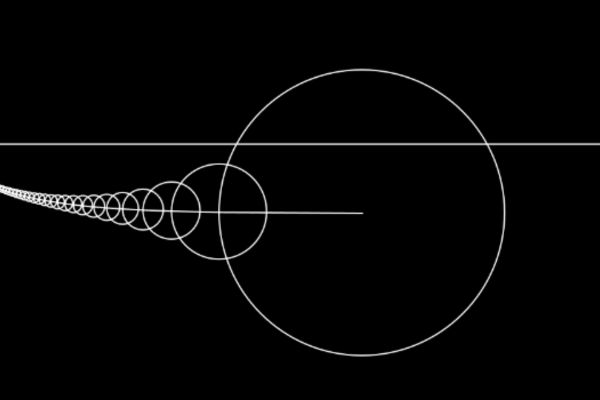
Dhanashri Wala | BTech CSE, Class of 2025
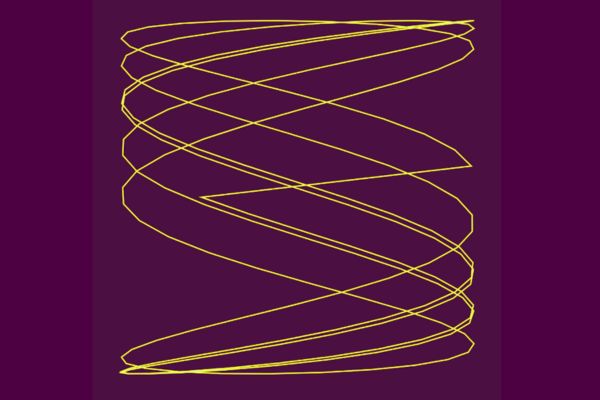
Interactive Lissajous Curve: This project combines math and art to create dynamic trigonometric patterns using the parametric equations ????(????)=????⋅sin(????⋅????+????) and ????(????)=????⋅sin(????⋅????). Users can interactively adjust X and Y frequencies, phase shift, and scaling, with vibrant, evolving colors enhancing the visualization.
Jyot Thakkar | BBA (Hons) Finance, Class of 2025
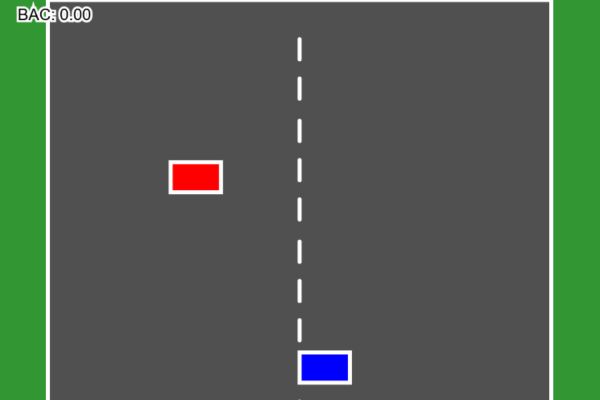
Drunk Driving Simulator: In this game, players control a car, but with each click, the driver's alcohol level rises, impairing their ability to drive safely. Players must avoid obstacles, and if the car collides with one, the game ends, highlighting the dangers of driving under the influence.
Aryan Prajapati | BTech CSE, Class of 2025
A* Algorithm Pathfinding Simulation: explores pathfinding algorithms visually in real-time. The interactive controls allow users to experiment with different layouts and observe how the algorithm navigates obstacles. This simulation is ideal for learning, testing, and demonstrating A* in various applications, from robotics to routing systems.
Nihar Kikani | BTech CSE, Class of 2027
Math Function Visualizer: This interactive tool allows users to input functions and visualize their graphs. It enables adjustments to parameters like amplitude, frequency, and phase, helping to explore the effects on curves such as sine, cosine, quadratic, and exponential functions. The project makes abstract math concepts more engaging and accessible.
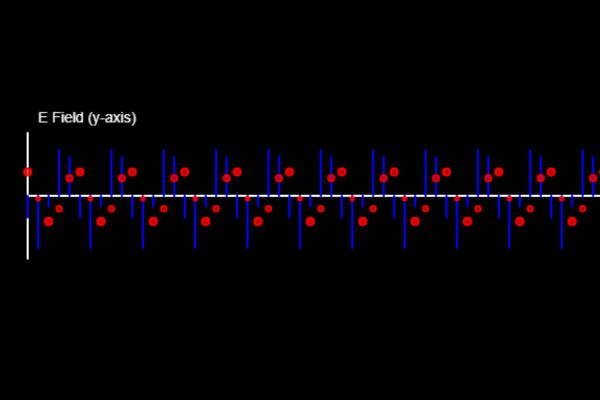
Aarohi Shah | BTech CSE, Class of 2027
Electromagnetic Wave Simulation: Visualizes the linear polarization of electromagnetic waves, showing electric and magnetic fields oscillating perpendicular to each other. Users can adjust parameters like amplitude, wavelength, speed, and frequency to see real-time changes, with sound that varies with frequency for an immersive experience.
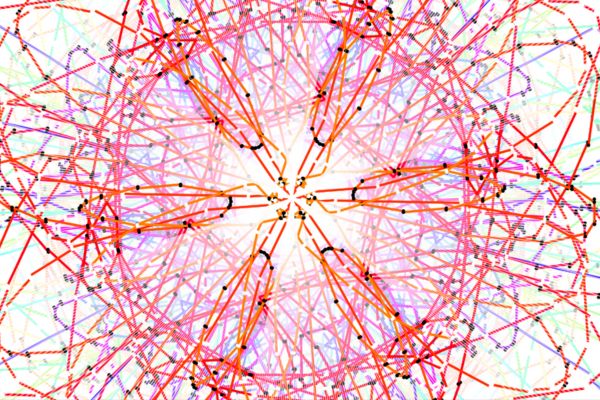
Aaditya Yadav | BTech CSE, Class of 2025
KaleidoLab: Explore concepts like symmetry, rotation, and dynamic visual patterns inspired by kaleidoscopic designs. Users can experiment with real-time symmetry manipulation, brush size, colour modes, and interactive drawing techniques.
Zeel Rajodiya | BTech CSE, Class of 2026
Newton's Laws of Motion: Newton's three laws of motion with interactive features. Users can apply force to an object, modify its mass, and observe how velocity, acceleration, and direction change. The simulation demonstrates inertia, acceleration (F = ma), and action-reaction principles, providing an engaging learning experience.
Renee Vora | BTech CSE, Class of 2027
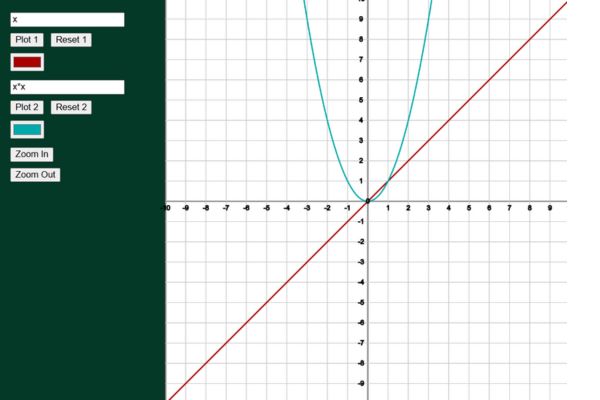
Graphing Calculator: This project creates an interactive graphing interface where users can input mathematical functions to visualise them on a Cartesian plane. Inspired by tools like Desmos and GeoGebra, it allows for easy exploration of mathematical behaviour, aiming to help students understand graphs while serving as a foundation for more advanced software.
Mitiksha Das | BTech CSE, Class of 2025
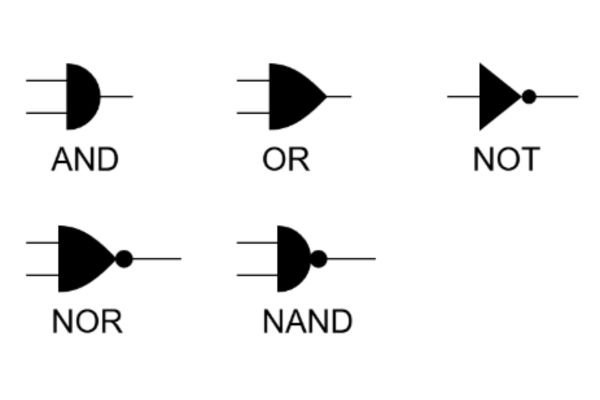
Logic Gates Simulator: This project visualizes basic logic gates (AND, OR, NOT) with real-time circuit diagrams. Users toggle input switches to observe immediate outputs, enhancing understanding of Boolean algebra and digital logic. It provides an engaging, hands-on approach to learning logic gates, bridging computer science and electronics concepts.
Ved Savalia | BTech CSE, Class of 2026
Gesture-Based Generative Art: This project uses the PoseNet model from ml5.js to convert body and hand movements into dynamic visual trails. Through webcam tracking, users create real-time, colourful patterns on the canvas, blending machine learning with creative coding to produce interactive, movement-driven artwork.
Tanay Shah | BTech CSE, Class of 2026
Kruskal’s Algorithm Visualizer: This project visualizes Kruskal’s algorithm, a greedy method for solving the Minimum Spanning Tree (MST) problem. Users can draw nodes, create edges with weights, and apply Kruskal’s algorithm to compute and display the MST.
Parth Mevada | BTech CSE, Class of 2026
Predator-Prey Ecosystem: This p5.js project models an ecosystem where herbivores and carnivores interact, with carnivores hunting herbivores and herbivores running faster. Users can adjust the population of each species and view a dynamic pie chart displaying their proportions over time, offering a hands-on approach to understanding ecological balance.
Kavish Parikh | BTech CSE, Class of 2026
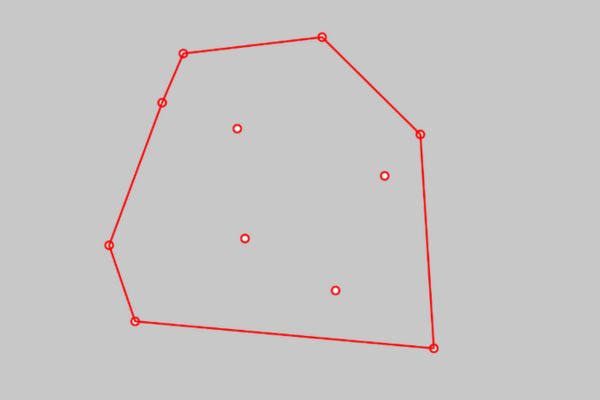
Convex Hull Visualizer: Visualizes the algorithm for solving the convex hull problem. Users can add points to the canvas with mouse clicks and generate the convex hull by pressing "Solve." The points are sorted and checked, with lines drawn and points highlighted as the hull is built. A "Reset" button clears the canvas for a new set of points.
Krish Patel | BTech CSE, Class of 2025
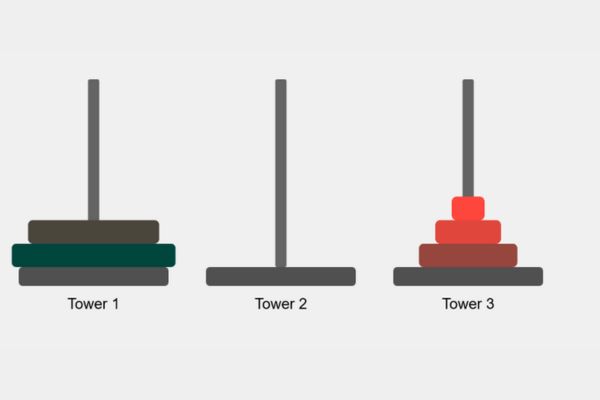
Tower of Hanoi Game: The Tower of Hanoi problem highlights recursion and divide-and-conquer methods. With three difficulty levels—easy (3-4 disks), medium (5-6 disks), and hard (7+ disks)—the game offers an engaging, hands-on tutorial to learn algorithmic concepts through problem-solving and practice.
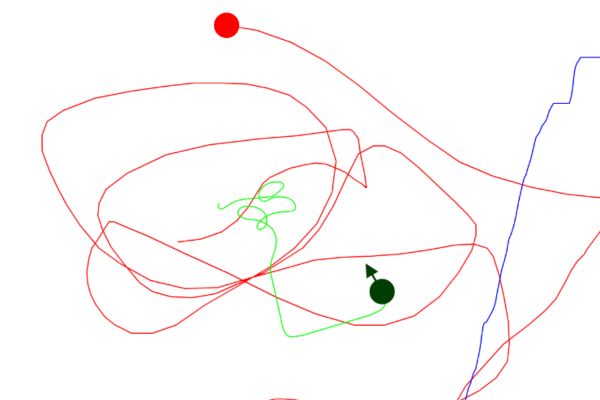
Muntazir Lakhani | BTech CSE, Class of 2027
Pursuit Path Simulation: A green pursuer follows a red target controlled by the mouse. The pursuer takes the shortest path to intercept the target, with real-time path visualisation, speed control, and a directional arrow. After the interception, it compares distances and times travelled.
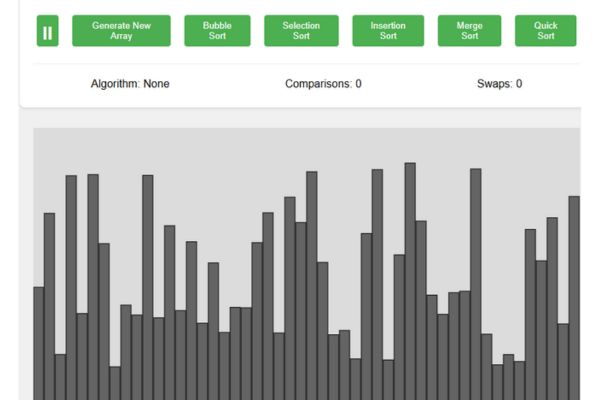
Bhargav Kargatiya | BTech CSE, Class of 2025
Sorting Visualiser: This interactive tool allows users to visualise sorting algorithms like bubble, selection, insertion, merge, and quick sort. Users can generate random arrays or input numbers manually, adjust the speed, and track comparisons and swaps, enhancing their understanding of the sorting process.
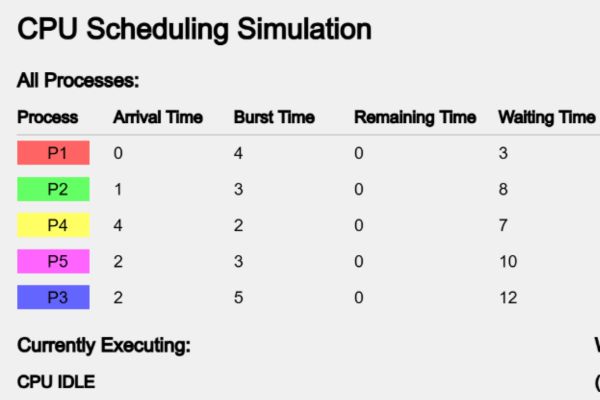
Parv Patel | BTech CSE, Class of 2025
CPU Scheduling Simulator: This simulator visualizes CPU scheduling algorithms like Round Robin, FCFS, and SJF. Users can observe time division, measure turnaround and waiting times, and analyze workload effects, making complex scheduling concepts more interactive and easier to understand. Built with p5.js for an engaging experience.